Perspective · 2026
A BENCH IS NOT A BUILDING.
Robot policies are evaluated on controlled test rigs and deployed into places nothing like them. That gap is where reliability is lost.
Key takeaways
- Most robot policies are evaluated on controlled rigs: fixed lighting, uncluttered surfaces, a single object, no people.
- Those conditions are repeatable, and they are nothing like the environments the robot has to work in.
- A policy that holds on a bench can fall sharply in a live warehouse, kitchen or production line, because deployment introduces conditions the evaluation never contained.
- A single success rate reports performance at one point in condition space, usually the most favourable point available, and conceals where performance collapses.
- The useful output is not a score. It is a map of which conditions hold and which break, under the conditions the system will actually meet.
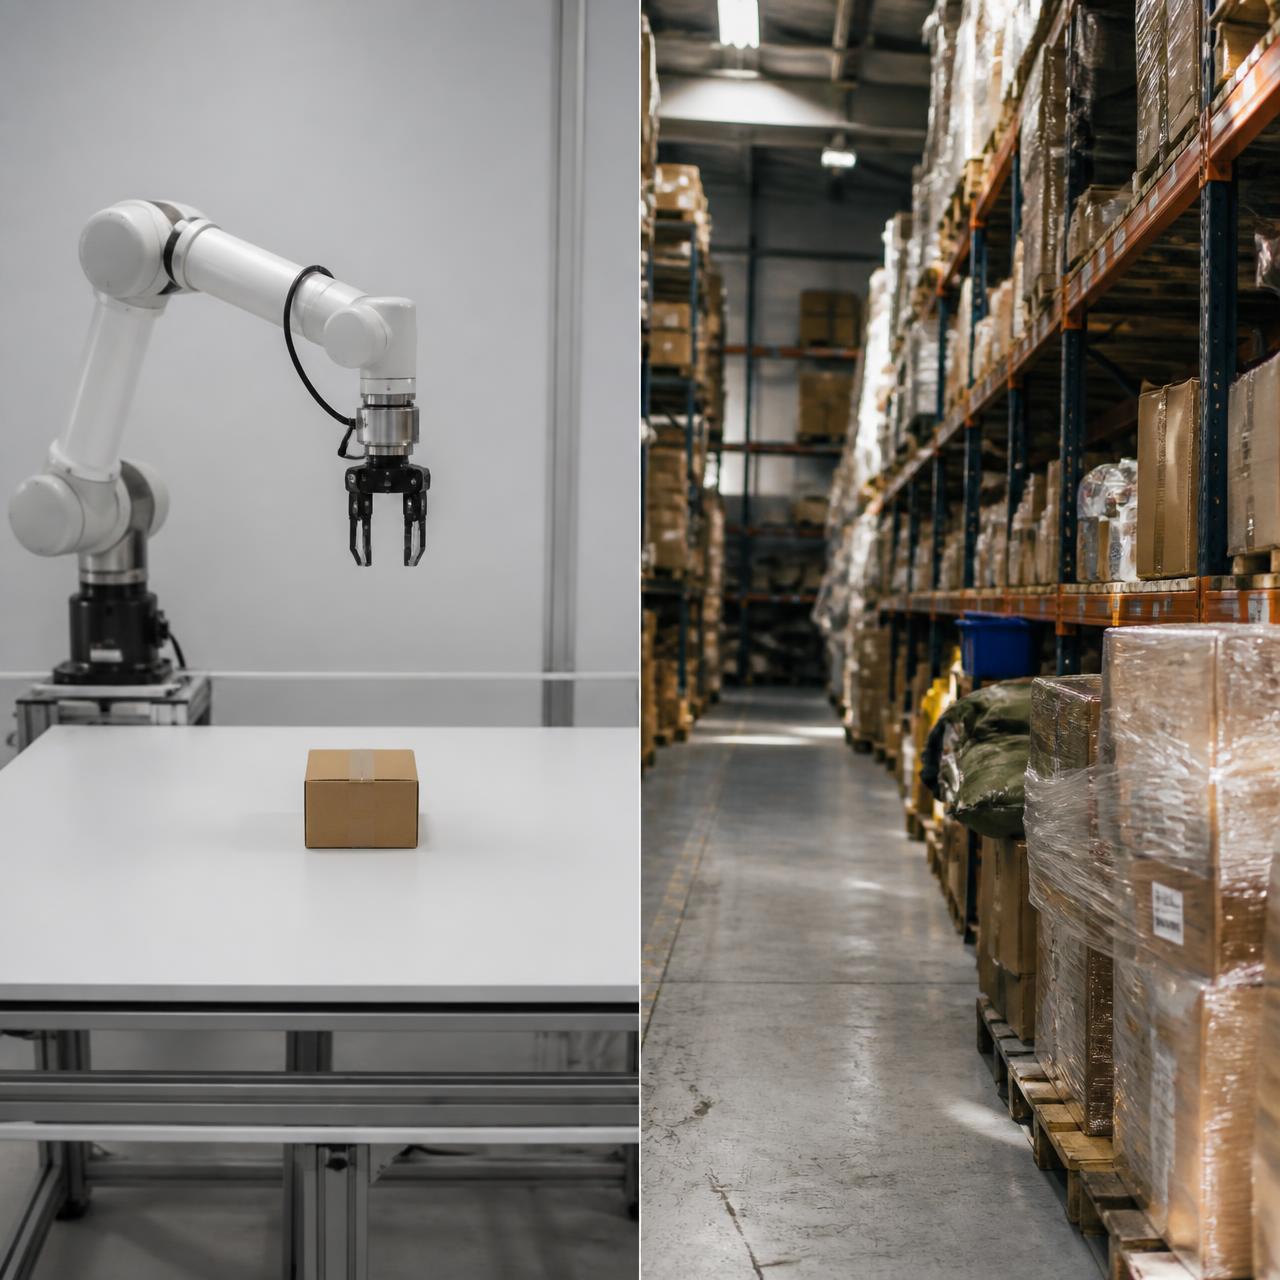
EVALUATION HAPPENS WHERE IT IS EASIEST.
Evaluation in robotics is usually conducted where evaluation is easiest. A test rig, a fixed camera position, controlled lighting, an uncluttered surface, one object at a time, no people moving through the space.
There are good reasons for this. Controlled conditions are repeatable, which makes results comparable between runs and between models. Without repeatability there is no measurement at all.
But repeatable is not the same as representative, and the gap between the two is where reliability is lost.
WHAT DEPLOYMENT ADDS
A live operating environment introduces, routinely and without warning:
- Reflective and damaged packaging that defeats depth sensing
- Targets partly obscured by other objects, or obscured at the moment of grasp
- Lighting that varies by hour, by fixture and by weather
- People crossing the workspace, moving the target, requiring the robot to yield
- Interruption, and objectives that change mid-task
- Surfaces that are wet, greasy, compliant or uneven
- Sensors that accumulate contamination and drift out of calibration
None of these is exotic. Each is ordinary in a warehouse, a kitchen, a shop floor or a hospital corridor. And each represents a condition that a controlled evaluation, by design, removes.
WHY A SINGLE SCORE CONCEALS THE PROBLEM
A benchmark result reports performance at one point in condition space. Usually the most favourable point available, because that is the point at which measurement is easiest.
Consider a policy reporting 92 per cent on a standard evaluation. That number is real. It may also conceal that performance holds above 85 per cent across seven conditions and falls below 40 per cent on partial occlusion. The single figure averages the collapse away.
The buyer's question is never "is this model good". It is "under which of my conditions does it stop working, and how does it fail when it does". A score cannot answer that. A profile can.
| What a score reports | What a profile reports |
|---|---|
| Performance at one point | Performance across each condition, at each intensity |
| An average | The location of the boundary where performance collapses |
| Pass or fail | Complete, complete with fault, partial, failed safe, failed unsafe |
| The result | The failure mode, and therefore the remedy |
The distinction between failing safely and failing unsafely is the one an operator asks about first, and it is absent from almost every published benchmark.
TESTING WHERE THE WORK HAPPENS
The alternative is not to abandon controlled testing. Baseline measurement under controlled conditions is necessary, because without it there is nothing to compare degradation against.
The alternative is to continue past the baseline. Establish performance under controlled conditions, then raise one condition at a time and record where the curve bends. Then combine the conditions that produced the steepest degradation, because deployment presents them together rather than one at a time. Then induce failure deliberately and record whether the system detects it, re-attempts, and recovers.
And conduct as much of that as the deployment allows in the environment itself, because a working kitchen produces steam, clutter, wet surfaces and human traffic in combinations that no test rig reproduces convincingly.
WHAT THIS CHANGES
It changes what evaluation is for.
Evaluated as a score, a policy is either good enough or it is not, and there is nothing to do with the result except decide.
Evaluated as a profile, every failure is specific and every specific failure is addressable. A policy that breaks on reflective surfaces under partial occlusion is telling you precisely which data its training never contained. The evaluation becomes a specification for what to collect next, and the improvement can then be measured against the same conditions that exposed the weakness.
That is the loop worth building: test where the work happens, find what breaks, identify what the training data was missing, build it, and test again.
The evidence that current data does not contain these conditions is set out in what the data actually contains. The nine conditions, their grading, and the evaluation protocol are specified in the Physicore Standard v0.1.
FAQ
- Is controlled testing worthless?
- No. A controlled baseline is necessary, because degradation can only be measured against something. The limitation is stopping there.
- What is a condition degradation profile?
- A report of success rate for each condition at each intensity, together with compound conditions and recovery behaviour, rather than a single aggregate score.
- Why does testing in the real environment matter if conditions can be simulated?
- Simulation and staged testing reproduce conditions that are anticipated. Operating environments produce combinations that are not, and those combinations are where deployment failures cluster.
- What is the difference between failing safely and failing unsafely?
- A system that detects a failure and reaches a safe state is materially different from one that fails and continues. Most benchmarks record neither.
— References
- Physicore Standard v0.1 — specification for physical AI data (PDF)
- Physicore — The Easy World: an audit of DROID (full research PDF)
- DROID: A Large-Scale In-the-Wild Robot Manipulation Dataset — arxiv.org/abs/2403.12945
- NVIDIA Technical Blog: evaluating general-purpose robot policies for real-world deployment
Figures used to illustrate the difference between a score and a profile are illustrative and do not describe a specific system.